2025 BTC 逃顶指标清单
本文作者:43A6@_43A6。作者文章在持续更新,可以关注最新内容。发文时间:2024年12月14日
本文作者搜集了30+各大免费指标网站,大部分指标都是公开算法,汇总而成2025年牛市比特币逃顶指标清单。
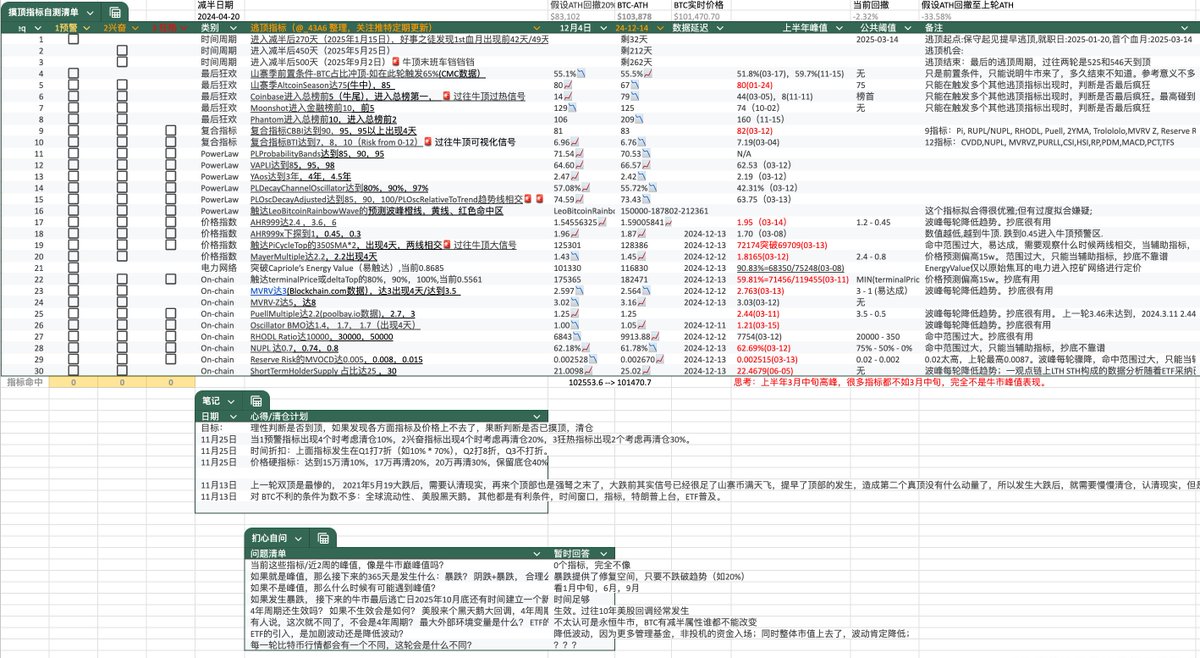
以下是其中主要的几个指标:
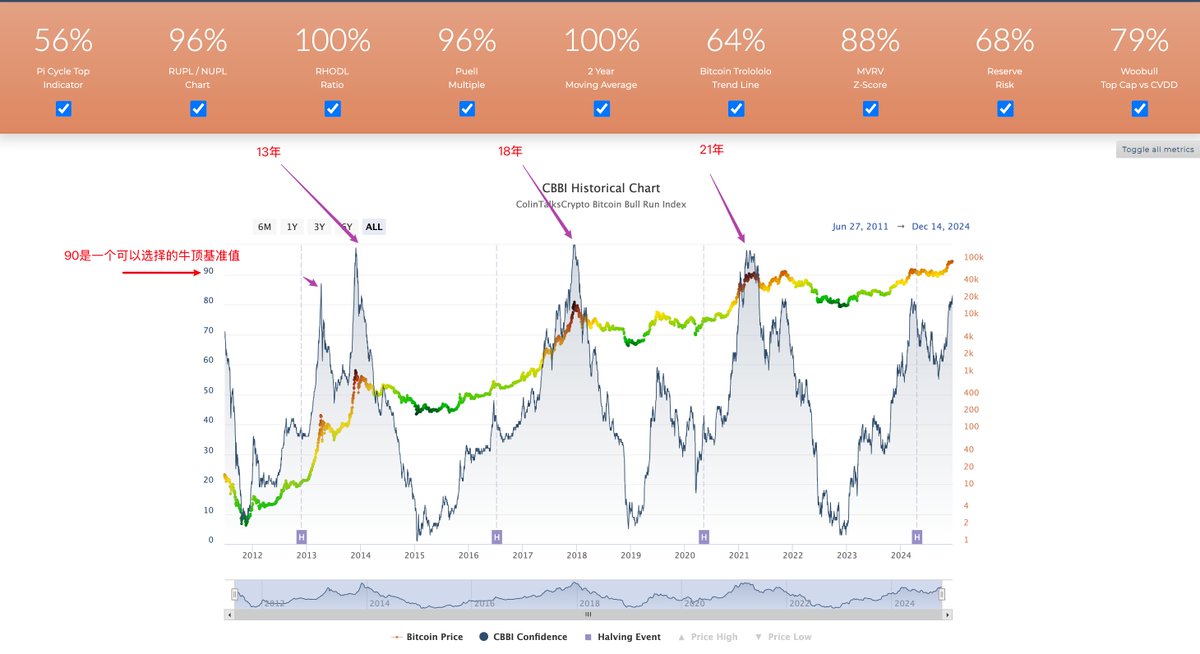
1. CBBI 复合指标
入围原因:
a.前三轮周期CBBI都达到95以上,其他时间无噪音。
b.综合了9个指标
缺点:如CBBI作者上一轮误判把Google指数当成指标(20多分拉低CBBI平均值)错过了最佳逃顶时期,9个指标中出了叛徒😄。
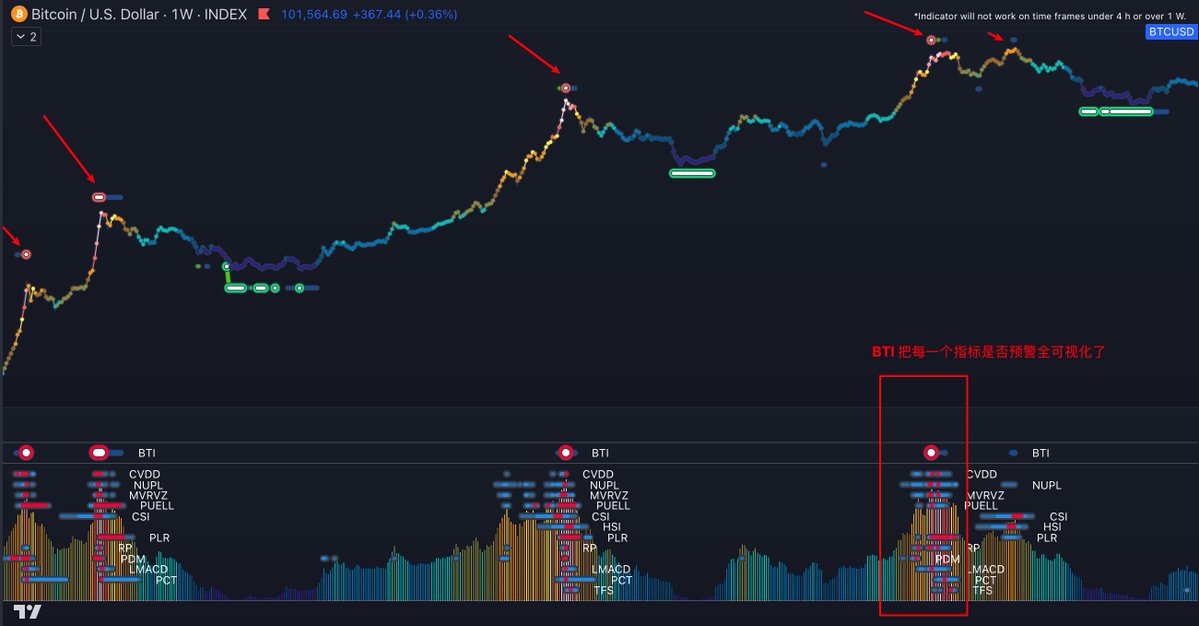
2. BTB和BTI指标
BTB和BTI指标分别是Bitcoin (BTC) Top and Bottom Indicator和Bitcoin (BTC) Top Indicator。比CBBI优秀的是:
a.可视化
b.既有总评估值6.76,又能快速在TV中展示具体子指标,防止错过
其他分析师都是云里雾里,高深莫测,别!别感觉,别废话! 好的指标是一图胜千言,是小学生都要能看懂的!
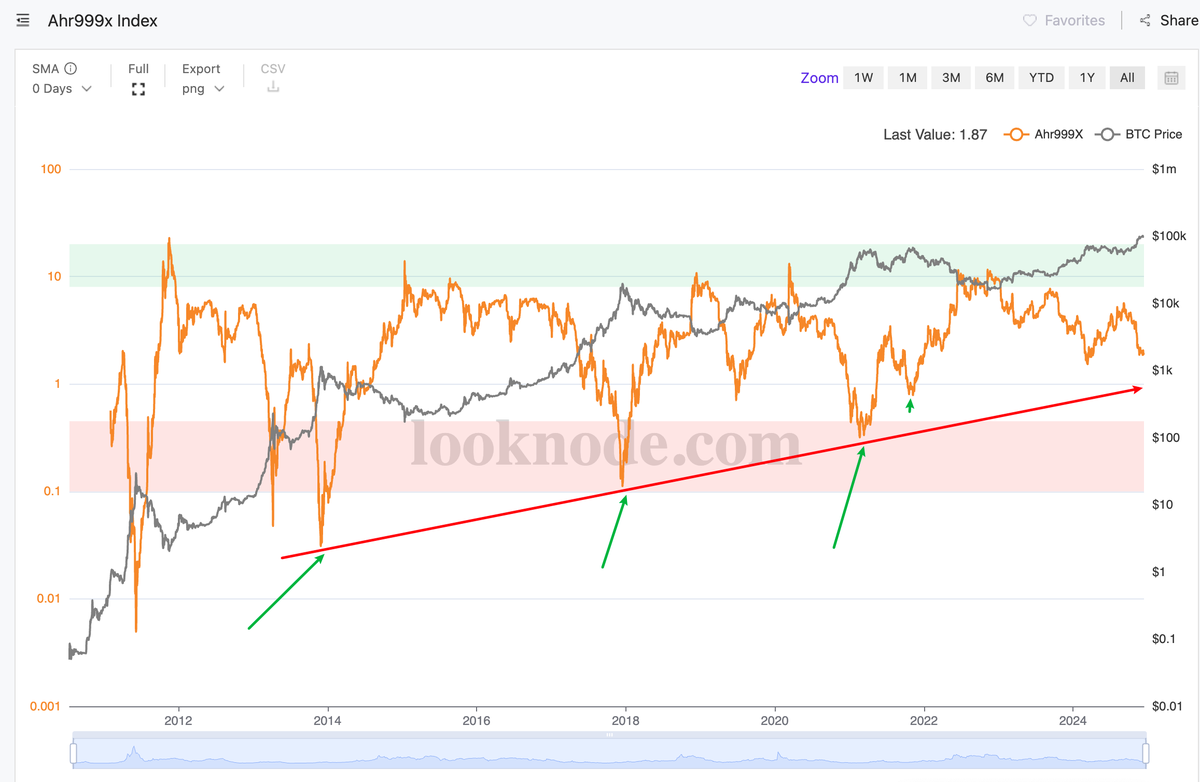
3. AHR999x
没那么优秀的指标AHR999x,图中显示每一轮牛市 这个指标会下探到底部红色区域,但一轮比一轮高。 那么可选的参考基准是 红色区域,但是如果这一轮的尖峰值没冲到红区呢?
一图胜千言, 所以这个AHR999x仅可辅助参考,如果盲信可能卖晚了。
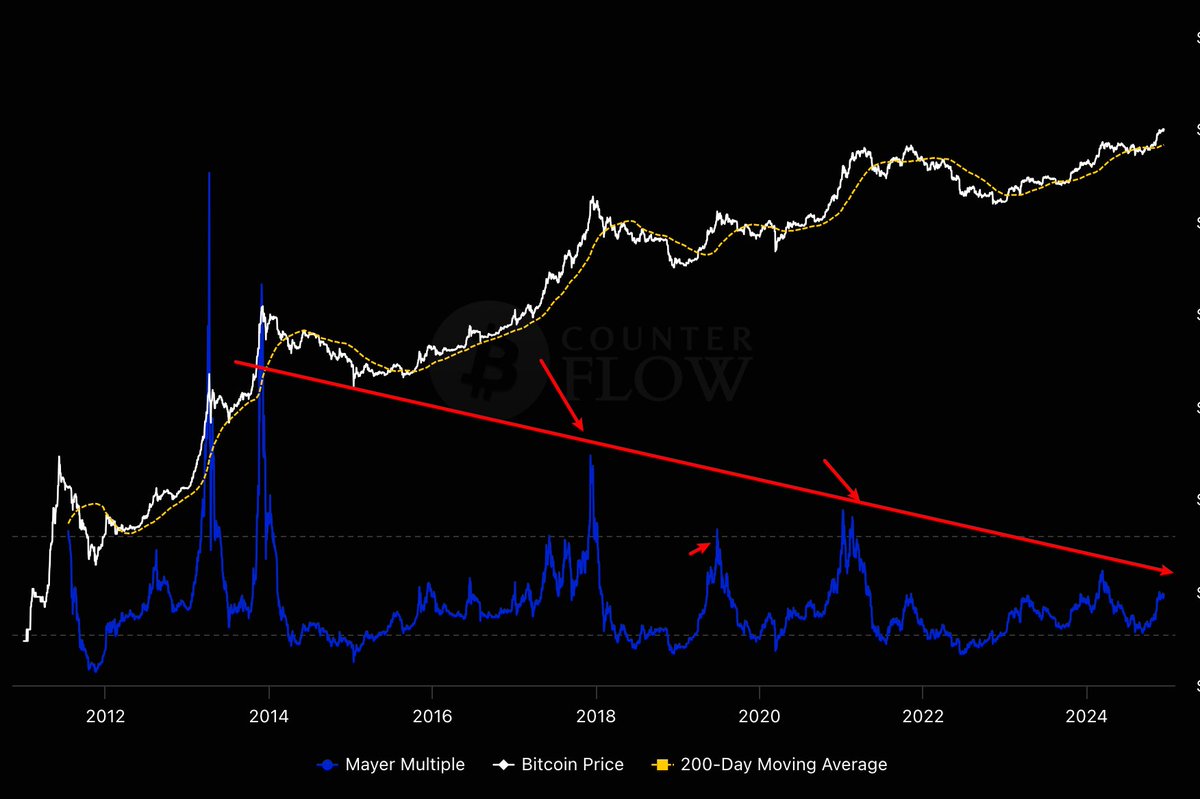
4.Mayer Multiple
同理 Mayer Multiple也有尖峰递减的隐患,只能当辅助。
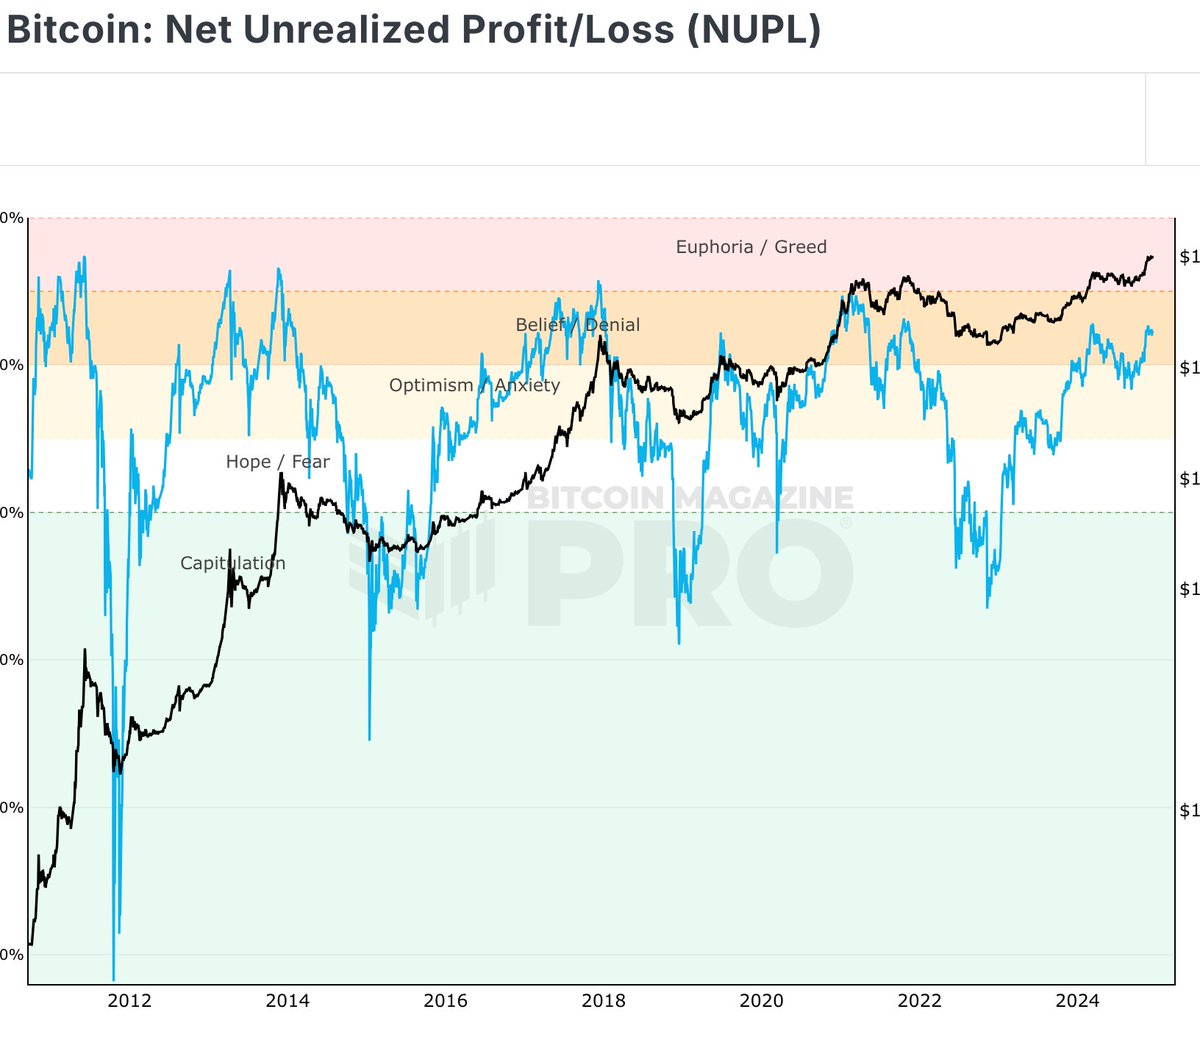
NUPL也有类似问题, 简单说就是 指标图不漂亮,和牛顶相关性差一些。
5. terminalPrice和deltaTop
看下图,每一轮牛顶都起码碰到了 terminalPrice和deltaTop的较小值(12月14日当前为182471,即此指标说明BTC价格应该达到18万)
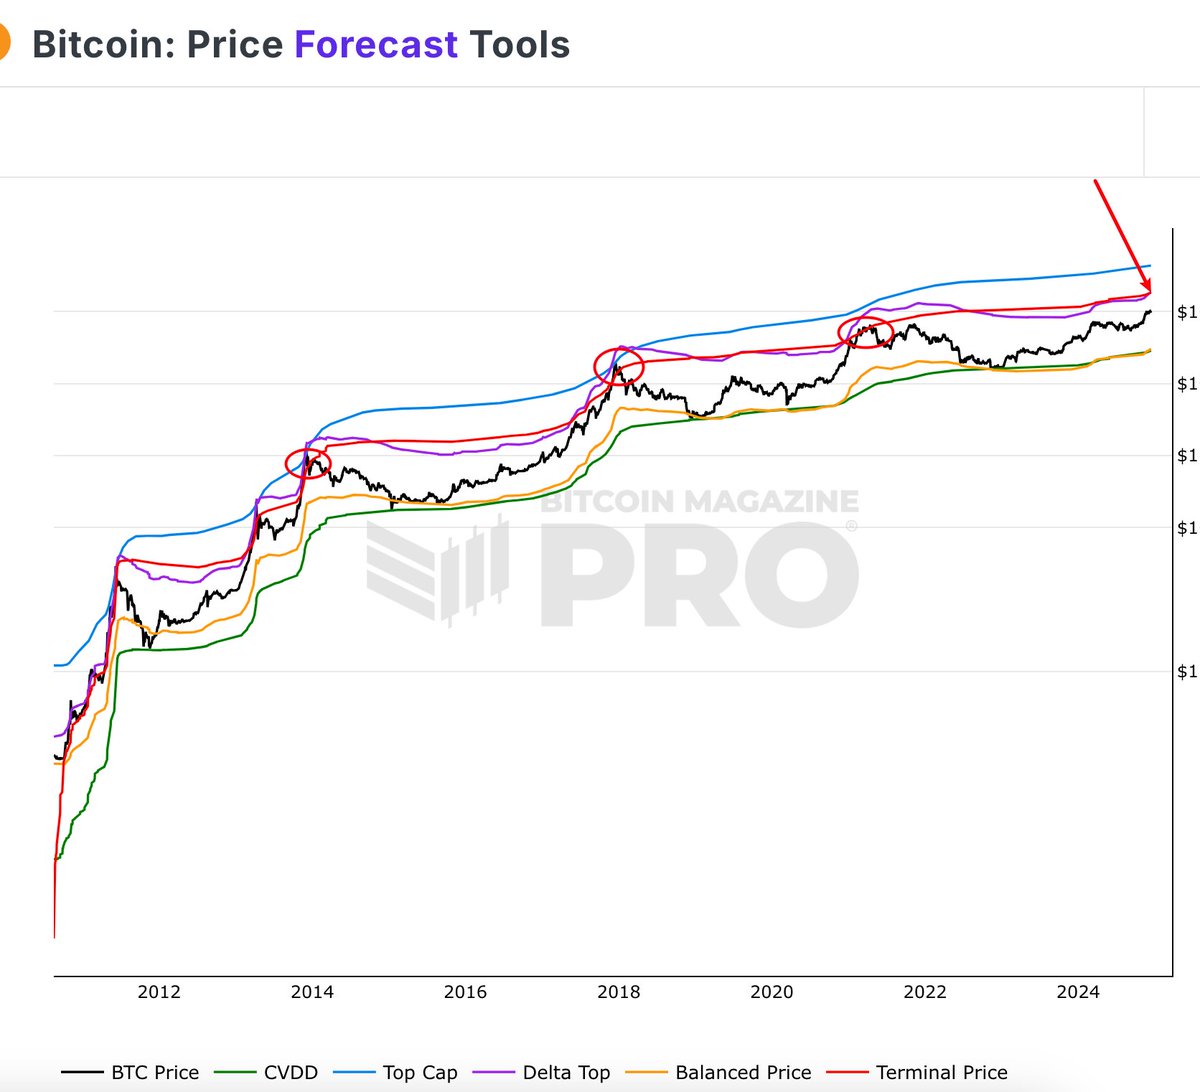
我摸顶清单中定义:触达terminalPrice或deltaTop的80%,90%,100%,当前0.5571 ,不过分吧。
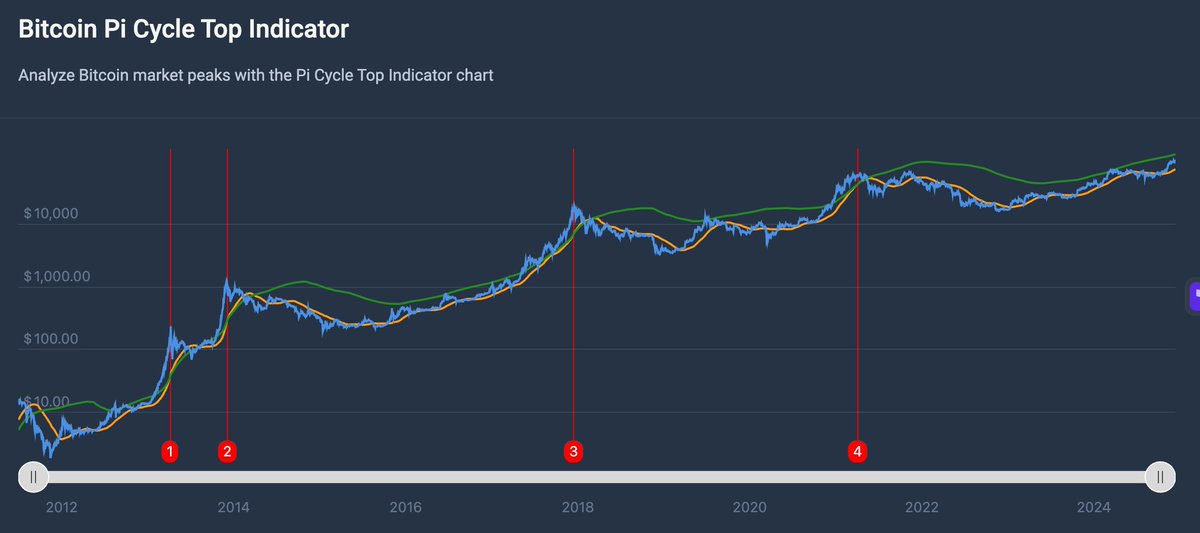
如果上一轮 相信PI Cycle Top 也能顺利逃顶,那么即使没等到 两线死叉,先碰到一条线的价格(12月14日为128386)可能会卖飞,
那些逃顶推主不考虑下12.8万再卖么?
6. MVRV-Z
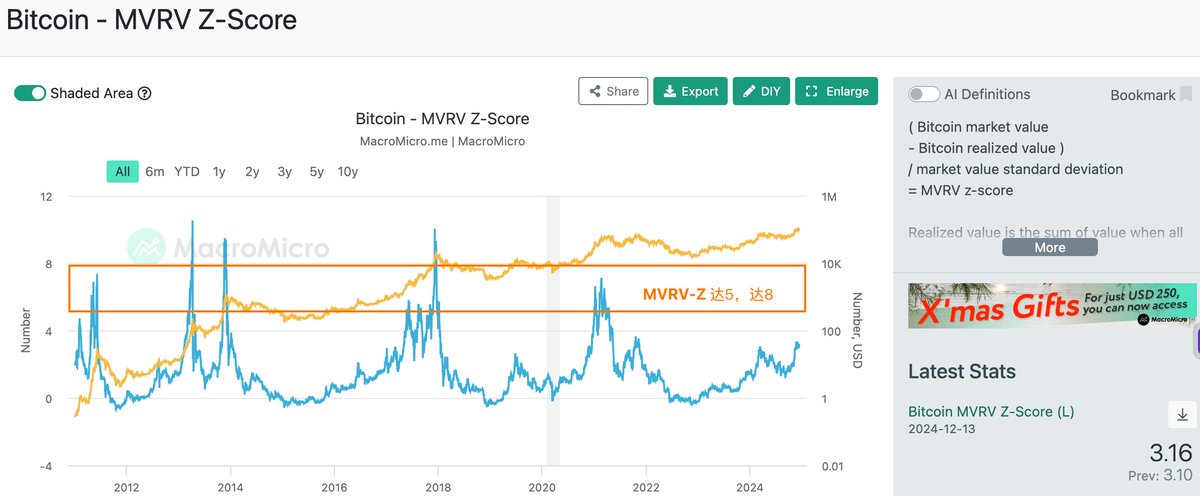
指标不太优秀,有尖峰递减的隐患, 所以我的摸顶清单中列的是: MVRV-Z 达5 达8
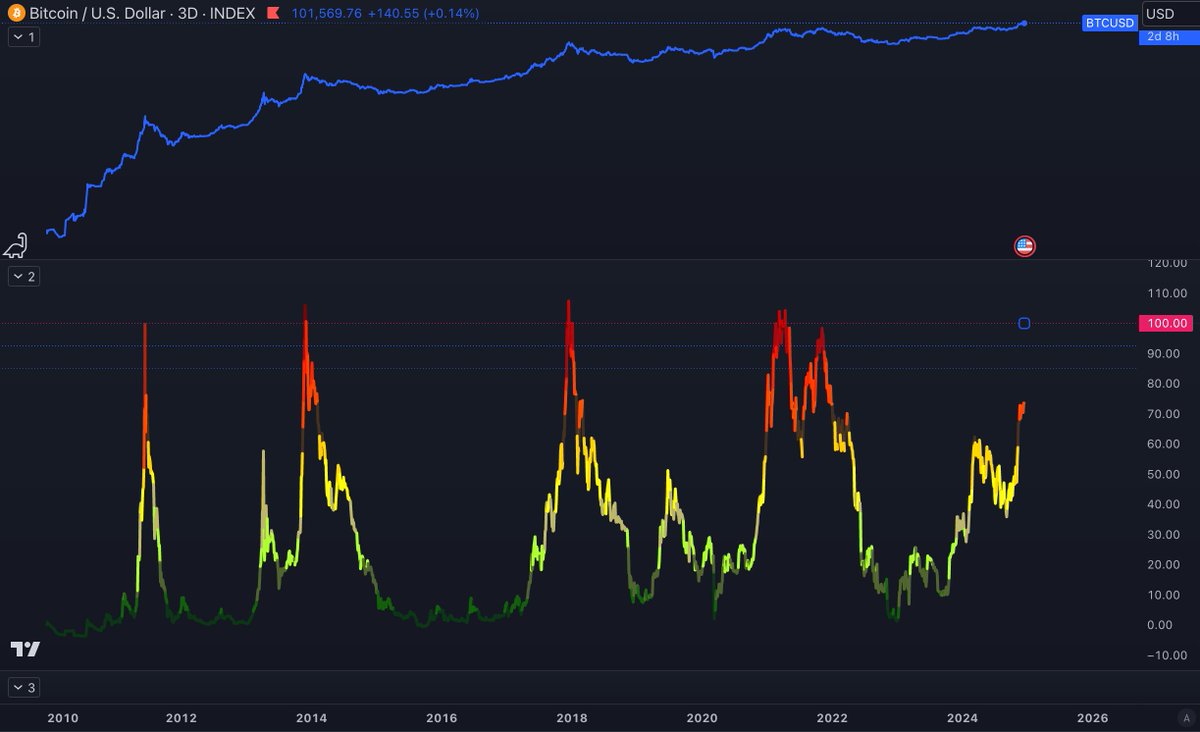
7、跪服的指标PLOscRelativeToTrend
优秀的指标是可以追踪到11年的牛顶的:PLOscDecayAdjusted达到85,90,100/PLOscRelativeToTrend趋势线相交🚨🚨
看图说话!优美!🧎
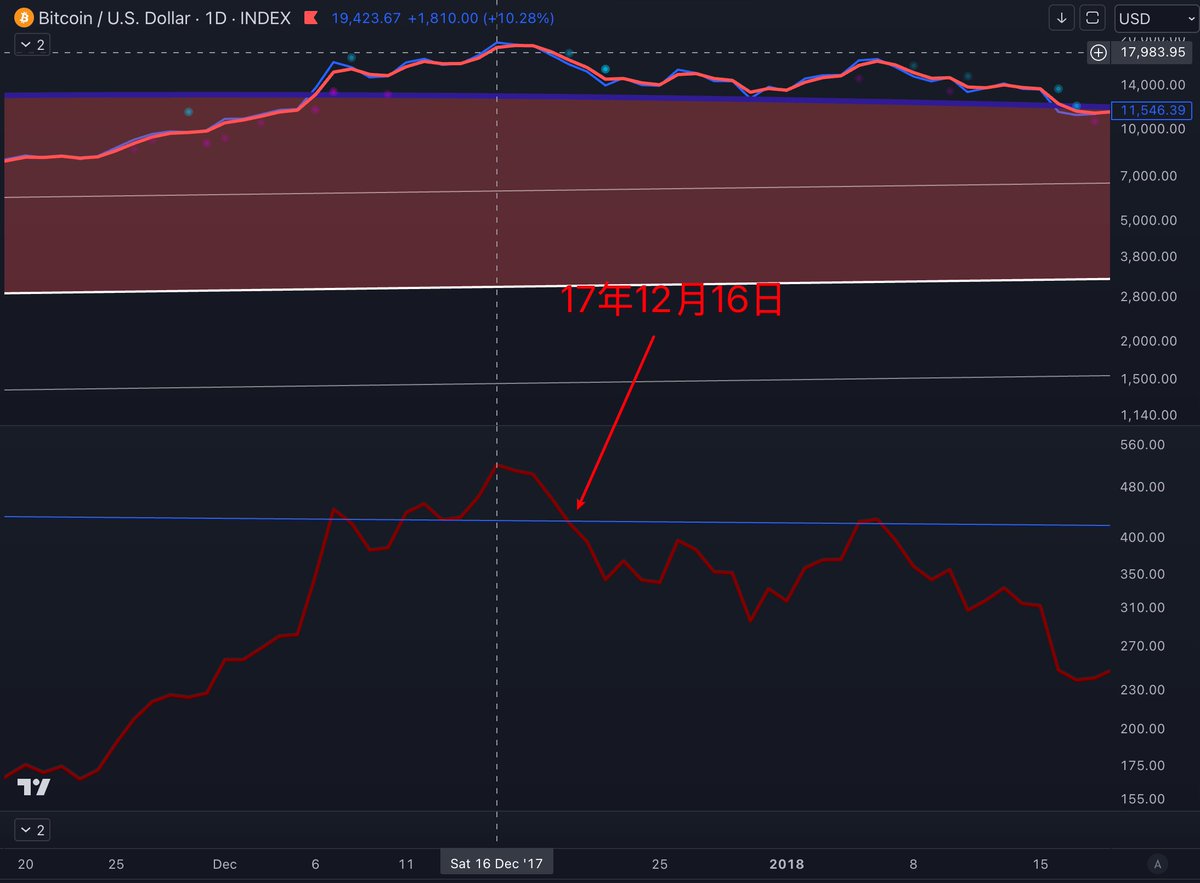
最后PLOscRelativeToTrend趋势线相交 是我见过最牛逼的没有之一的指标,他的缺点就是过于完美。
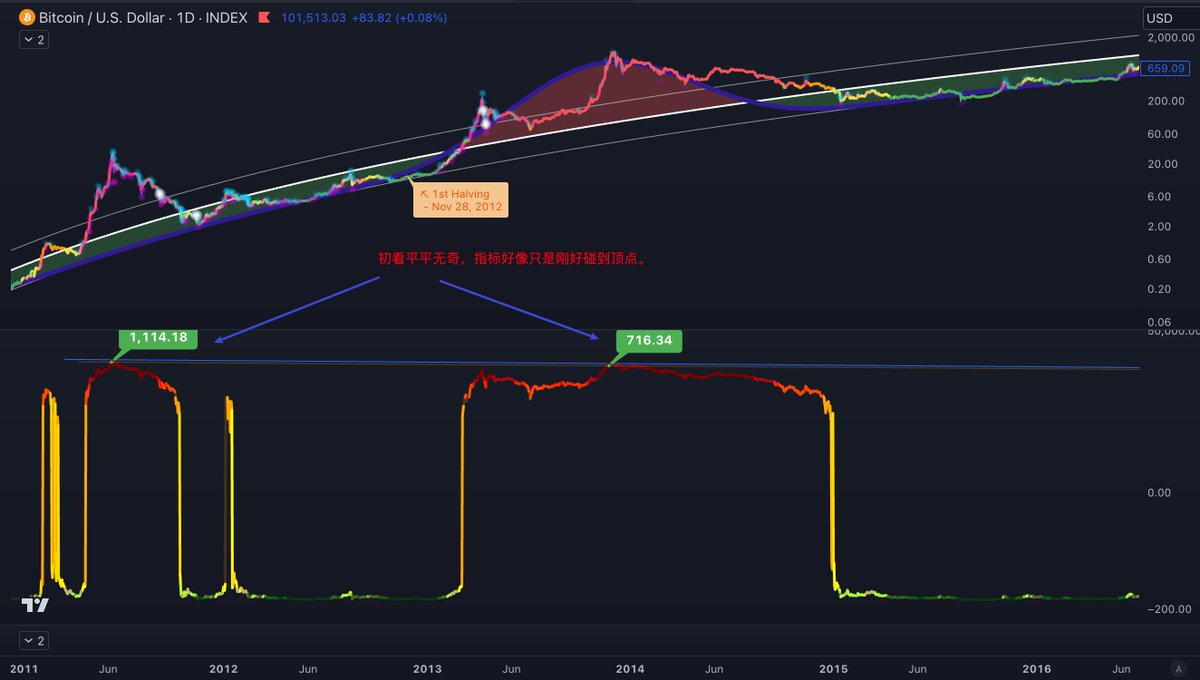
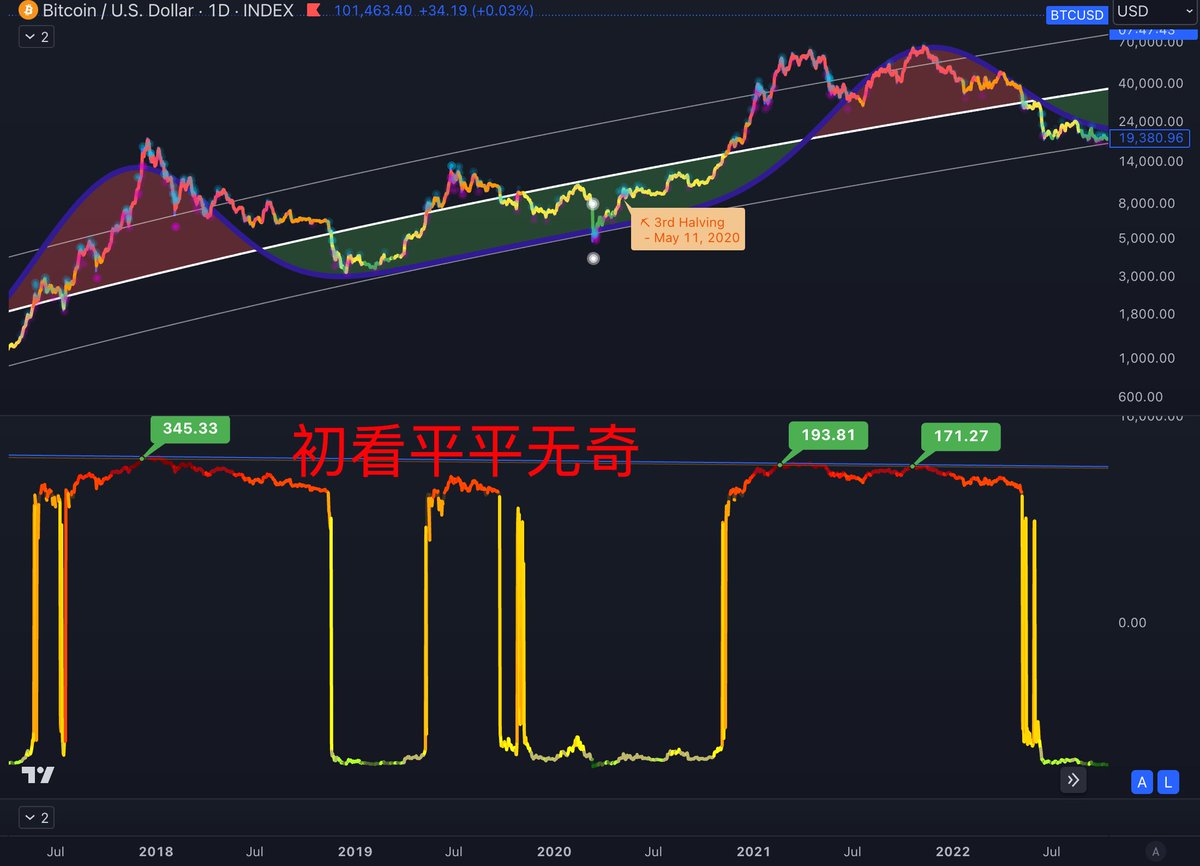
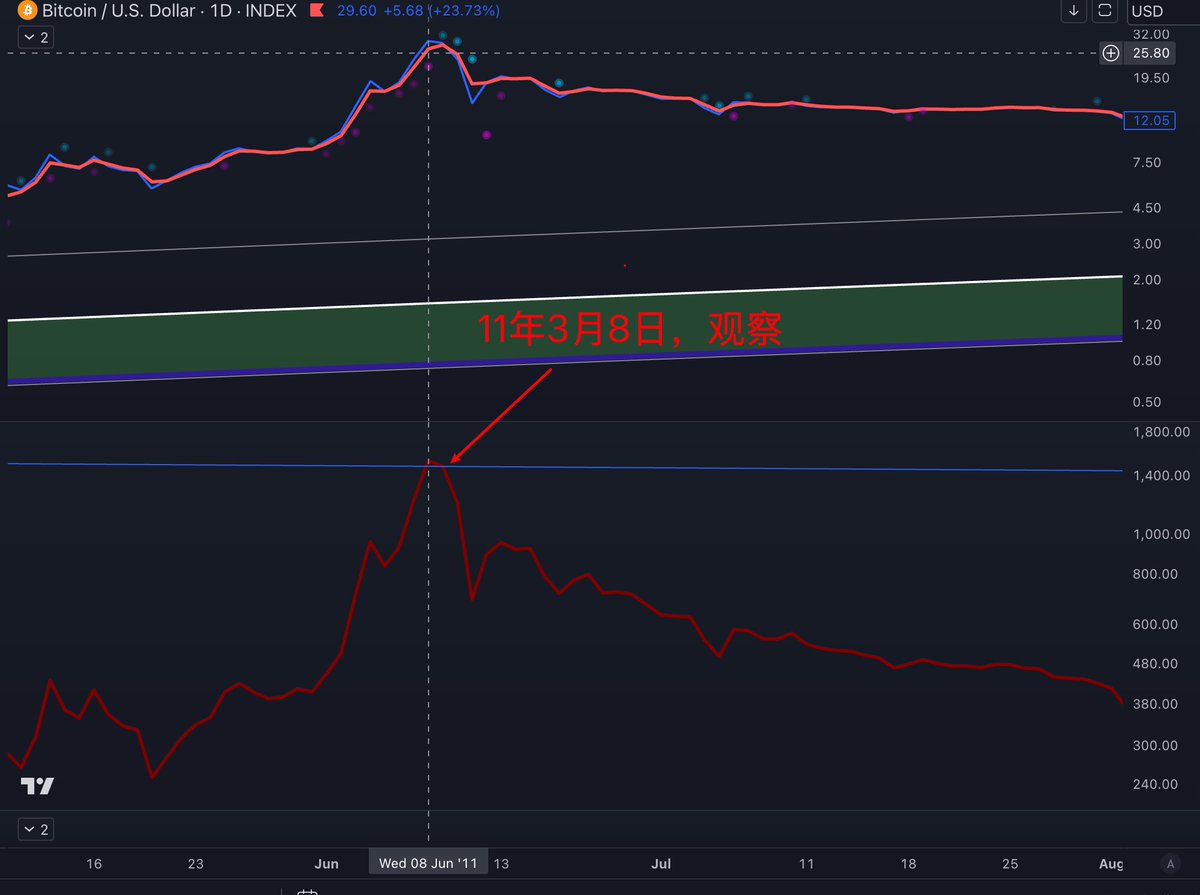
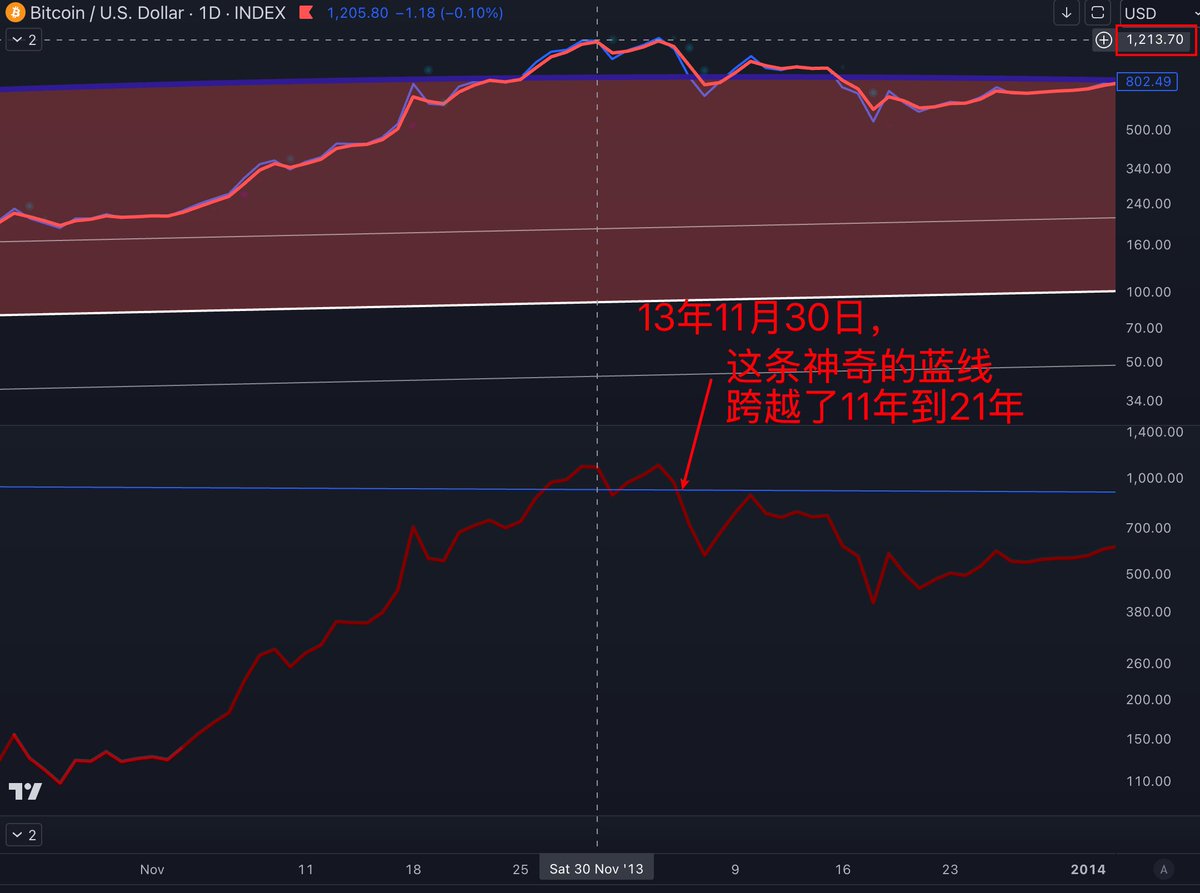
时间跨度上,价格极限上,这两点在此指标都是独一份的。摸顶都过于完美,11年到21年所有极限牛顶都展示了,只是理性考量我们不应该追求极限牛顶,鱼尾很难啃。
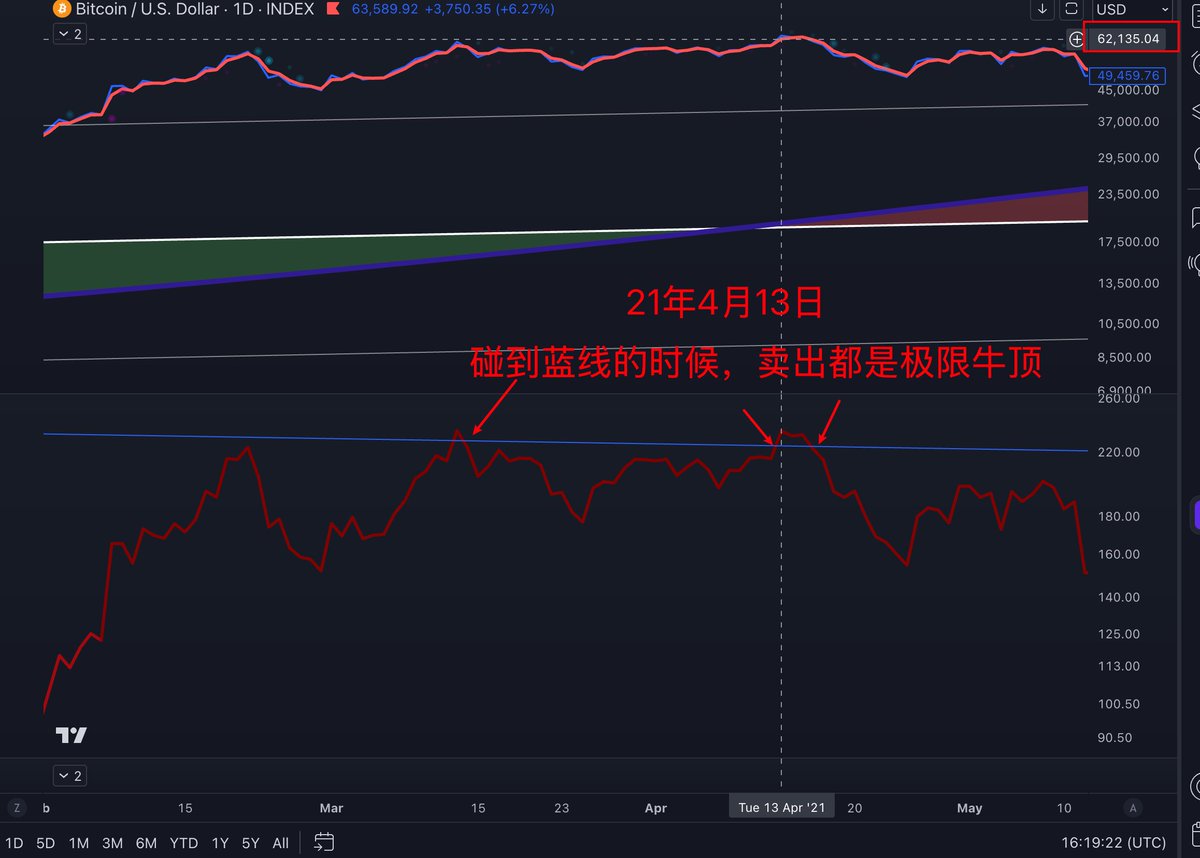
但是拿这个指标做最后的牛顶告警 非常棒!